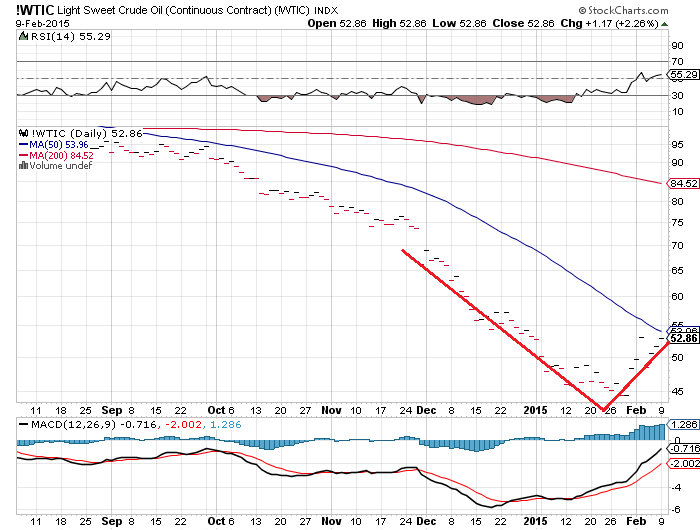
Oil is simple: an almost constant, smooth decline in price until last month, followed by a V shaped bottom coming out of the minimum. Since about Jan. 26, it's been higher highs and lows.
Light sweet crude from StockCharts; the dark red lines are mine. Around here, regular gas went from $2.03 to $2.17 between the Saturday, Jan. 31 and Saturday, Feb. 7. I have no reason to think gas will go that low again for quite a while.
Gold also looks like it has hit a bottom and started to recover.
I could draw the upper bounds differently, but the important thing to notice is that since early November, the trend has been higher highs, with a healthy amount of retracing, to test those. We could be coming to a flag pattern in the next few weeks. This one bears watching.
Silver is the most difficult of these, but, again, since about the same time in early November, the white metal has been recovering. The channel it's riding in is pretty consistent. Both silver and gold showed a dip on June 3rd of last year. Silver's bounce back was more dramatic than gold's and it was harder to draw an upper boundary.
In all these cases if you wanted to buy on the bottom, you missed it.
Let me give a little perspective on all of these things. The earliest prices I can recall for a gallon of gas were around 20 cents a gallon: "19 and 9" because Florida prices always ended in that 9/10 of a cent. Today's silver price of $17.05 says one of today's greenbacks is worth about 8.11 cents of 1964 silver. In other words, one of today's dollars isn't worth a 1964 dime. Today's gas price of about $2.15/gallon would cost 17 1/2 cents back in 1964. Maybe the prices I remember weren't from 1964; but gas is basically the same price it was in 1964, measured against a standard. Higher gas prices aren't from "peak oil", they're from worthless dollars.
My standard disclaimers:
- Prediction is difficult - especially about the future.
- My definition of "Technical Analysis" is drawing random lines on financial plots and pretending they mean something.
- If you're taking financial advice from some random internet dood, you deserve to lose everything.


You remember correctly. In the late 50's I remember gas wars at 16 and 15 cents a gallon. In the late 60's it was 21 cents a gallon for regular and 25 cents for the high priced spread at Chevron.
ReplyDeleteNineteen cents is high for 1964. Anonymous is closer at 15 to 16, and he/she is exactly correct for late 60's, early 70's.
ReplyDeleteAnyone think it might vary by state (taxes) and market? The late fifties is the earliest I recall prices. In New York (middle of Long Island - Lake Ronkonkoma), it was 14 cents in 1958. In 1964, I recall it being 17 cents.
ReplyDeleteIn 1968, when I got my first car (instead of using my father's), a 1962 VW Bug, it was 20 cents a gallon.
Four years later, in 1972, I was working in Connecticut hospital ER as an orderly. The price for a gallon of leaded regular had jumped up to _75 cents_ a gallon there, and I thought the world was coming to an end. (I was making $1.18 an hour at that time, and unemployment was high in our neck of the woods)