I've been covering forecasts of how active this sunspot cycle will be since well before it started. The consensus was that the current cycle (25) is going to be much like the last one. Which was the weakest cycle in about a hundred years. In fact, one group presented data in 2018 saying cycle 24 was the weakest solar cycle in 200 years. In April of '19, when NOAA presented its official forecast, they used this graphic to show the similarity of cycle 25 to 24.


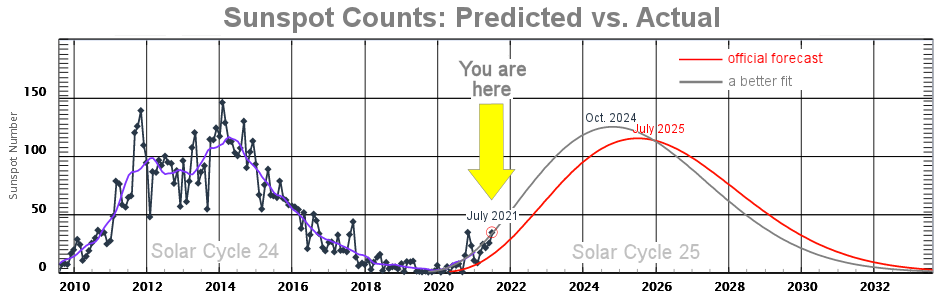
As you can see, since about the spring of '20, the actual sunspot numbers have run higher than predicted every month. Spaceweather notes:
Issued by the NOAA/NASA Solar Cycle 25 Prediction Panel in 2019, the official forecast calls for Solar Cycle 25 to peak in July 2025. However, a better fit to current data shows Solar Cycle 25 peaking in October 2024. This is just outside the 8-month error bars of the Panel's forecast.
July 2021 was a remarkable month. Solar Cycle 25 crossed multiple thresholds, including its first X-flare and, at one point, 6 sunspots on the solar disk. The last time so many sunspots were seen at the same time was Sept. 2017 (SWx archive). One farside CME in July was so strong it affected Earth despite being on the "wrong" side of the sun. A handful of other CMEs narrowly missed our planet.
Is the more important part of the prediction also affected, how high the Sunspot Number will be, and not just that it will peak at a meager sunspot number sooner? The better fit link in that first copied paragraph does indicate a slightly higher sunspot count in October '24, on the order of 10% higher (rough estimate). You might remember that just about a year ago, a paper was released based on a new method of analyzing existing data and predicting a cycle "magnitude that rivals the top few since records began." The graphic they presented predicts the Smoothed Sunspot Number could be as much as twice what's predicted above in that plot from Spaceweather.

It's an interesting prediction, but when a new group comes along with a whole new way of looking at a problem that has been studied for years, they either suddenly revolutionize the field or fail and go away. We'll see what happens with this prediction.
In the mean time, and we should know by the end of '24, we watch and wait. I noticed earlier in the summer and in the late spring that we got days where solar flux went into 90s, instead of the 70s where I'd just gotten used to seeing it. The higher HF bands (12 and 10m) definitely sounded better than usual.
The Svensmark hypothesis explains the "Hiatus" of warming in the last decade pretty well.
ReplyDeleteSurely this must be a RESULT of global warming!!!
ReplyDeleteThere's a plot on Spaceweather most of the time that shows the Svensmark hypothesis as perfectly as anything you can imagine.
ReplyDeleteMidway down the page, it's down the page and called Cosmic Rays in the Atmosphere. This plot is updated regularly. They measure high altitude cosmic rays from a balloon. You can see incoming cosmic rays going up toward solar minimum and now going back down as the activity picks back up.
Mark - the most remarkable thing about that global warming is that it can be seen on every other planet!
10 Meters has been open a few times, along with 17 Meters. 20 Meters was staying open until after 2200 LT, which was quite a surprise to me. Still haven't seen any notable activity on 15 Meters or 12 Meters, except in the digital sub-bands. 75 Meters is open in the evening, and 40 Meters starts getting active in the early evening.
ReplyDeleteWe're thinking of getting a pergola over the back patio, so I'll have a place to properly mount my 40 Meter quarter-wave vertical again. I ran some numbers the other day, and it's the right length for a 5/8-wave vertical on 17 Meters, which might explain why it worked so well on 17.
Maybe it's a latitude or location thing, but 17m is open pretty much every day here. I use the digital bands to see if the bands are open, so I listen whenever I have the rig on.
Delete12m is open to South America regularly when SF is in the mid-70s, likewise 10m.
Yes, the digital sub-bands always seem to be "open". I'll look at the panadapter and see the signals down there, while the phone portion of the band is dead.
DeleteI've been on-the-air much, much more since I got the new radio, and I'm starting to recognize voices and callsigns, something that hasn't happened in years.