I ordinarily post these updates every six months, but what happens is I go to the source website and if they don't have the charts up to date early in the month I tell myself to go back in a few days. Six months from the last update was in August; I went to the source and the July update wasn't there. I forgot to go back until now.
You can see the real numbers keep tracking below the predicted values (in red), with a tendency to be quite low - a smoothed sunspot number of 10 when the predicted is 40. The last six months show more variation than the stretch from late 2015 through the February report.
As a refresher, the dark blue line is the Smoothed Average, the last three readings averaged; the dark dots are individual readings while the featureless red curve is the predicted value. This solar cycle is predicted to hit its minimum around 2020, which is still quite a while away. The sunspot number is likely to get quite a bit lower, running around zero by late 2017 and staying that low for several years. Note that when you see a sunspot number of 35, that doesn't mean you could look at the sun and find 35 separate spots; its a weighted combination of groups and the spots in those groups. There's an excellent explanation here.
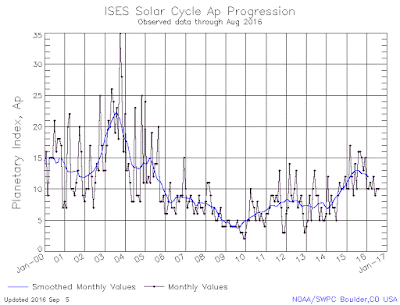
I've also been tracking the Planetary A index, a measure of geomagnetic storming, every 6 months, and the August chart follows:
It appears to have reached its interim peak in the last six months of charting and is trending toward lower levels, too, but is still on a par with levels from the declining years of the last cycle: 2006 and a couple of spikes through 2008. As I've said before, while I don't understand it, the "tribal knowledge" in amateur radio circles is that geomagnetic disturbances tend to be more common in the declining years of a sunspot cycle. The previous cycle (cycle 23) peaked at the end of 2002; and storming increased until mid '2004 (that A index peak at the end of '04 was the largest solar flare observed in the satellite era).
And to quote myself even more:
As I've posted before, this is the weakest solar cycle in 100 years, which means no living solar scientist has seen a cycle this weak, and our records of what the sun was doing back then are more sparse than what's available now. Since no living scientist has seen a cycle this weak, expect all predictions to be even less accurate than usual.My interest in solar activity grew out of the shortwave radio listening hobby I started when I was about 13 years old. That was in the cycle right after the strongest one on record, which peaked in 1957. Solar activity acts to increase the density of the ionosphere, which raises the frequency at which radio waves are bent back to Earth. Following the highest frequency that will propagate between two points, the Maximum Usable Frequency or MUF, is generally the way to hear (or talk with) the most distant points on the globe with the lowest loss of signal. It's only in the last 20 years or so has it seemed that the solar cycle might affect things like our climate, our food supply, and life in general.


HF propagation has been pretty crummy lately.
ReplyDeleteStill, we've had some very good 10 meter openings, an 20 sometimes stays open into the evening.
We are approaching the equinox, and that equal heating of both north and south hemispheres helps propagation. 10 and 12 ought to be better for a month or two.
DeleteYep, cue up the TE propagation!
ReplyDeleteIt's CO2 ... wait, no, it's guns ... oops, racism. That's it, racism.
ReplyDelete:)
Q